Incident Details
When you open an incident, the screen is divided into three panels: a left panel with incident data, a central map, and a right panel for features and layers.
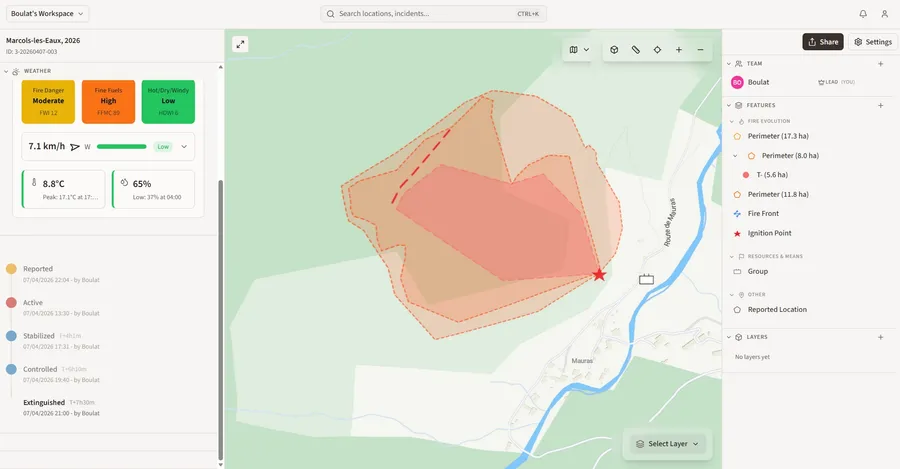
Left panel
Section titled “Left panel”The left panel contains the incident properties and several collapsible sections.
Properties shows the core fields:
- Type — Wildfire or Prescribed burn
- Location — address and region
- Verified — who verified the incident and when
- Duration — time since ignition
- Burnt area — in hectares if known
The following sections can be expanded from the left panel:
Weather — fire weather conditions recorded at the time and place of ignition: temperature, wind, humidity, and danger indices.
Timeline — full history of status changes. Each entry records who changed the status and when. To update the status, click the current status badge and select the next one.
Wildfire statuses progress through: Reported → Active → Stabilised → Controlled → Extinguished
You can also mark an incident as Escaped or False Alarm. Timestamps can be adjusted if the change happened earlier than when you are recording it.
Media — photos and videos attached to the incident. See Media.
Evaluations — post-incident assessment forms. See Evaluations.
Right panel — Features
Section titled “Right panel — Features”The right panel manages everything drawn on the map.
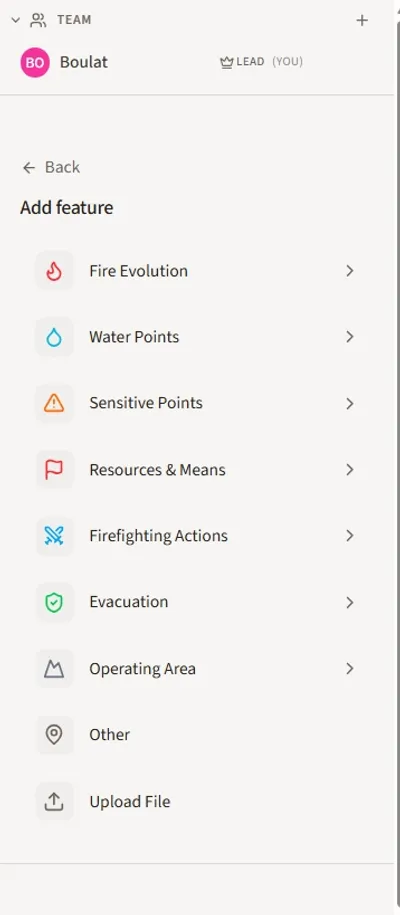
Click + next to Features to add a new element. Available categories:
| Category | Examples |
|---|---|
| Fire Evolution | Perimeters, fire front, ignition point |
| Water Points | Hydrants, natural water sources |
| Sensitive Points | Infrastructure, populated areas |
| Resources & Means | Vehicles, groups |
| Firefighting Actions | Tactical lines, drop zones |
| Evacuation | Evacuation zones and routes |
| Operating Area | Sector boundaries |
| Other | Free-form geometries |
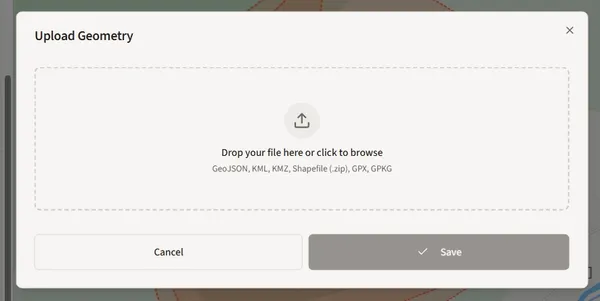
| Upload File | Import a geometry file |
Selecting Upload File opens the geometry import dialog, which accepts GeoJSON, KML, KMZ, Shapefile (.zip), GPX, and GPKG formats.
Right panel — Layers
Section titled “Right panel — Layers”The Layers section sits below Features. Click + to upload a raster layer — drone orthophotos or other geotiff imagery.
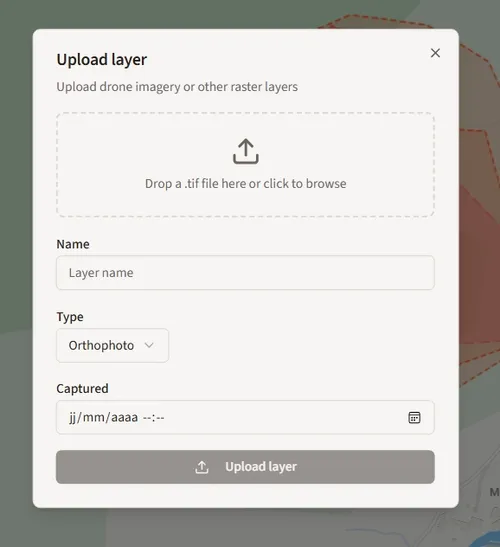
Fill in the layer name, type (Orthophoto or other), and the capture date, then click Upload layer. The layer appears on the map immediately and can be toggled on and off.
Click + next to Team to assign a lead or add contributors. A QR code invite can be generated for team members to join the incident directly from their device.
- When viewing a past incident, the map automatically shows conditions at the time of ignition — useful for post-incident analysis
- You can jump status steps — no need to go through every stage in order