Draw Fire Perimeters
Questi contenuti non sono ancora disponibili nella tua lingua.
Drawing the fire perimeter gives your team a clear picture of the affected area. You can sketch it by hand on the map, upload a file from another system, or track how the fire grows over time.
Draw on the map
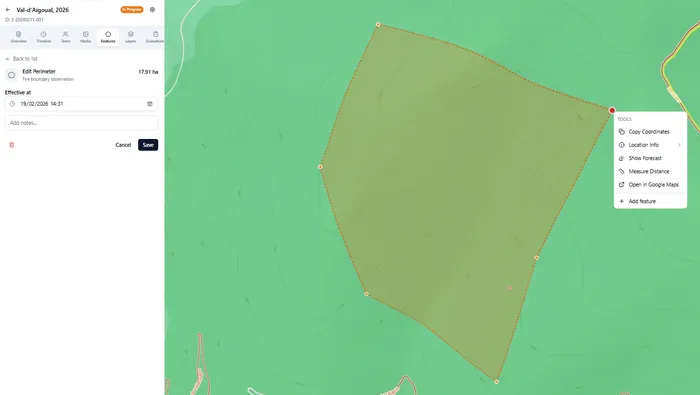
Section titled “Draw on the map”From the incident detail, open the Perimeters tab:
- Ignition point — click the map to mark where the fire started
- Perimeter — click to place points around the fire boundary, then close the shape by clicking the first point (or double-click to finish)
While drawing:
- The map cursor changes to a crosshair
- Instructions appear at the top of the screen
- Press Esc to cancel
You can delete or redraw any geometry after placing it.
Upload a map file
Section titled “Upload a map file”If you have perimeter data from another tool (GPS tracker, GIS software, drone mapping), click the Upload button in the Perimeters tab.
Supported formats:
- GeoJSON
- KML
- KMZ
Track fire progression
Section titled “Track fire progression”When you upload a file that contains multiple timestamped boundaries, Wildflyer detects this and offers to import them as fire progression data (isochrones).
This creates a time-lapse view of how the fire grew — each boundary is tagged with a timestamp, and you can step through them on the map to see the fire’s spread over time.
Mark the authoritative perimeter
Section titled “Mark the authoritative perimeter”If multiple perimeters have been drawn (e.g. initial estimate and a later GPS-confirmed boundary), you can mark one as authoritative. This is the one used for burnt area calculations and shown by default.
- You don’t need a perimeter to create an incident — start with just a location and add the perimeter when you have better information
- The ignition point gives you the most accurate weather data, since Wildflyer reads conditions at that exact location
- Perimeters are visible to everyone in your organisation, so field teams and coordinators stay in sync